


Follow our progress from the idea to the publication of Daphne Draws Data—coming this September!


Cole’s scatterplot sketch


Could a dragon teach kids about turning data into graphs and problem-solving through an engaging story?

Cole has written three books for grown-ups, but crafting a story for kids has been a different adventure! Constraints abound. The typical illustrated children’s book is exactly 32 pages (due to the size of the paper that runs through the printing press) and shouldn’t have too much text. Cole spent a LOT of time making sure the story is simple, informative, and engaging!

The journey from the first word to the final draft was filled with writing, rewriting, and a ton of editing. Cole didn't do it alone; she worked together with her copy editor, Marika. She also shared early versions, complete with doodles of characters and Daphne's data drawings (see an example to the right), with more than two dozen readers (grown-ups and kids alike) to gather feedback. Cole used the input to polish and perfect the story, preparing it for the illustration process.
Cole knew John Skewes through his popular Larry Gets Lost book series that her own kids loved, and she was thrilled when he agreed to draw Daphne. The illustration process was tackled in three steps:
1. Character design
Cole sketched what Daphne might look like for her initial draft. Then John developed two alternate ideas. They discussed what they liked about each, and then Daphne was brought visually to life!

At this point, the front cover was also designed and finalized.

2. Rough layout
Next, the story was divided across the 32 pages and the illustrations were planned.
John sketched his ideas and shared them with Cole for her input.
On the right you can see an example rough two-page spread.
3. Full color composition
The next main step of the illustration process was to add full color and details, also bringing consistency to elements across the pages.
On the right, you can see the updated version of the same two-page spread shared above.
After another round of iterating on illustrations, plus continued editing of the manuscript, it was time to hand the pieces over to the design team to bring it all together.


Next came the design phase of the project. From selecting typeface to designing and setting pages, this is where everything comes together into the final files that will become the book. Here’s how we tackled it:
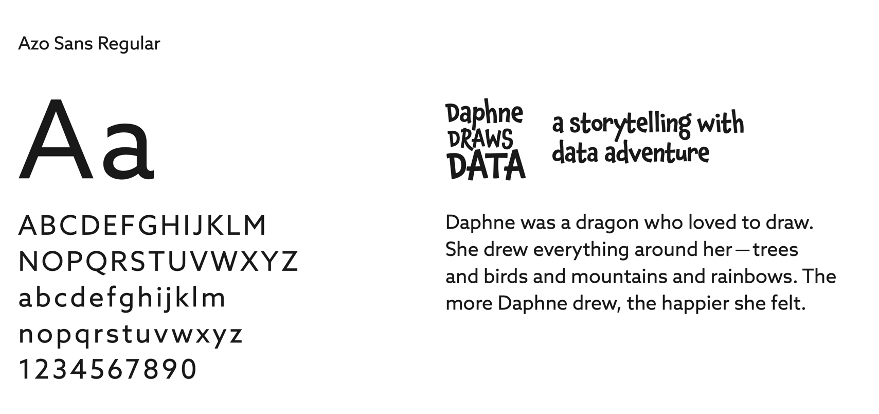
The first decision we made was which typeface to use for the main story text. We were after something that complements the title typeface, Chaloops. After looking at various options in sample spreads, we chose Azo Sans, which is the same typeface that you’re reading now!
After the story typeface was decided, Matt laid out the text with the illustrations for the entire book. Cole printed the pages and provided guidance to John and Matt for final tweaks to the illustrations and layout. To the right, you’ll see a final 2-page spread from Daphne’s adventure into outer space.
See the process: from doodle to final pages


The final files have been sent to the publisher!
The printer is currently making the plates that will be used in the printing press to print the pages, cover, and dust jacket of Daphne Draws Data. The book will print next month!
If you’re interested in learning more about the printing process (it’s fascinating!), check out the video below.
Here’s a sneak peek of Daphne’s underwater adventure, where she helps settle a disagreement between the shrimp and crabs using data. Isn’t it fun to see the progress from early draft to final form?!

John’s initial sketch

John’s full illustration

After Matt has set the page
Can you believe we’ve gone through this process for every single one of the 16 two-page spreads? We’ve put a great deal of thought into every detail and are excited to share the book with you this September!

1. Select story typeface
2. Set pages
JUNE UPDATE

Daphne’s data-drawing adventures are accompanied by a Glossary of Graphs. In addition to pie charts (shown on the right), readers can learn more about bar charts, line graph, and scatterplots, too.
At this stage, we also designed the dust jacket that will wrap around the book.